衰老是生物随着时间推移的必然过程,是复杂的和自然的生命现象。人体衰老过程中的生理变化主要体现在细胞功能丧失,机体代谢减慢,组织器官衰竭,最终导致死亡。衰老是生命的一个普遍特征,是很多疾病的危险因素,是不可避免的,但延缓衰老却是可能的。阐述导致衰老的机制和发展延缓衰老的技术,对于防治衰老相关疾病和延长健康寿命至关重要。
机体基因组DNA组装形成染色质并存储在细胞核中,核小体是染色质的基本结构单元,主要由组蛋白和基因组DNA组成,在DNA复制与基因转录过程中发挥着高度动态调节作用。组蛋白H2A泛素化修饰是一类重要的修饰方式,在调控染色质空间构象、核小体动态结构、基因转录、细胞周期及DNA损伤修复等过程中起着重要的作用。
MYSM1是一种去泛素化酶,其主要功能是去除组蛋白H2A的泛素化修饰。MYSM1在造血功能,免疫系统,皮肤、组织、视力、骨骼发育,浆细胞分化,干细胞免疫调节,树突状细胞抗原提呈,以及炎性因子分泌等功能中起着非常重要作用。因此,MYSM1是一种不可替代的表观遗传学修饰的关键因子。
2020年9月30日,国际权威性杂志《Advanced Science》《尖端科学》在线公开发表了吴建国团队的研究成果(https://doi.org/10.1002/advs.202001950),文章题目是“MYSM1 suppresses cellular senescence and the aging process to prolong lifespan”,第一作者为田明富博士生,通讯作者为吴建国教授,该研究得到了国家自然科学基金重点项目(项目编号81730061) 和面上项目(项目编号81471942)的资助。
该团队发现MYSM1能显著抑制细胞衰老、阻碍衰老相关疾病发生发展、延缓机体衰老进程、从而延长寿命。通过详细和深入研究,证明了MYSM1具有能抑制人和小鼠的原代细胞的细胞衰老现象以及延缓小鼠组织器官病理发生发展的功能;揭示了MYSM1通过促进机体DNA损伤修复,从而阻碍细胞衰老、延缓衰老进程、降低病理发生发展的机制。通过动物试验研究发现,MYSM1敲除的小鼠,衰老进程明显加快、衰老相关疾病显著加重;与其相反,MYSM1治疗的小鼠,衰老进程明显延缓、衰老相关疾病显著减轻。更重要的是,与未处理的正常小鼠的平均寿命(20–26个月)相比,MYSM1敲除的小鼠的平均寿命(13–16个月)明显缩短,MYSM1治疗的小鼠的平均寿命(28–30个月)显著延长。可见,MYSM1是一种阻碍细胞衰老进程、防止衰老相关疾病发生、延缓生命周期的关键细胞因子。因此,MYSM1很有希望成为预防衰老相关疾病以及延长健康寿命的有效和创新药物。
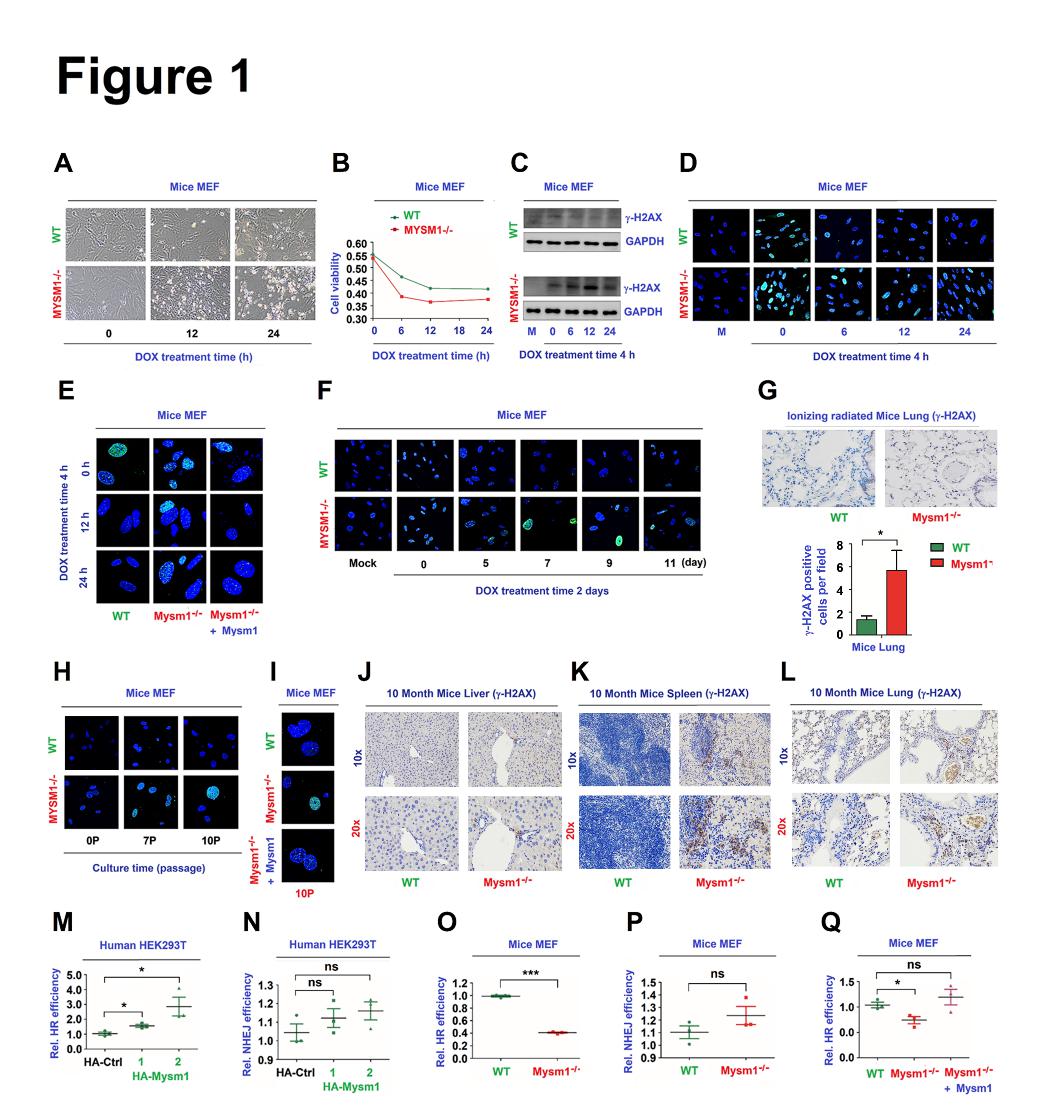
Figure 1. MYSM1 promotes HR mediated DNA repair.(A and B) of WT MEFs or Mysm1-/- MEFs were treated with DOX. Cell images showing the cell cytotoxicity (A). Cell viability was measured using the CELL COUNTING kit-8 (B). (C–E) WT MEFs and Mysm1-/- MEFs (C, D) or WT MEFs, Mysm1-/- MEFs, and Mysm1-/- MEFs transfected with Flag-Mysm1 (E) were treated with DOX to induce DNA damage. g-H2AX and GAPDH protein levels were detected by Western blotting (WB) (C). g-H2AX protein was detected by anti-g-H2AX antibody and visualized under a confocal microscope (D, E). (F) MEFs were treated with DOX for 2 days to induce DNA damage. g-H2AX protein was detected by anti-g-H2AX antibody and visualized under confocal microscope. (G) 2-month old WT and Mysm1-/- mice (n=3 per group) were subjected to IR. The levels of g-H2AX in the lung were determined by IHC. Scale bars, 50µm. (H) MEFs were grown continuously for different passages to induce DNA damage. g-H2AX levels were detected and visualized under a confocal microscope. (I) MEFs were grown continuously for 10 passages to induce DNA damage. g-H2AX levels were detected and visualized under a confocal microscope. (J–K) Liver, spleen, and lung were excised from 10-month-old WT and Mysm1-/- mice (n=3 per group). The levels of g-H2AX were determined by IHC. Scale bars, 100× =100µm, 200× =50µm. (M–P) Human HEK293T cells (M, N) and mice MEFs (O, P) were co-transfected with a HR reporter system (M, O) or a NHEJ reporter system (N, P), along with pCMV-DsRed and HA-Ctrl or HA-Mysm1. The efficiencies of HR (M) and NHEJ (N) were determined. (Q) MEFs were co-transfected with the HR reporter along with pCMV-DsRed and Flag-Ctrl or Flag-Mysm1. The efficiencies of HR were determined. Data are presented as the means ± SD. Statistical analyses were performed using Prism software by Unpaired t-tests. *p<0.05, **p<0.01, ***p<0.001, n.s.= no significance.
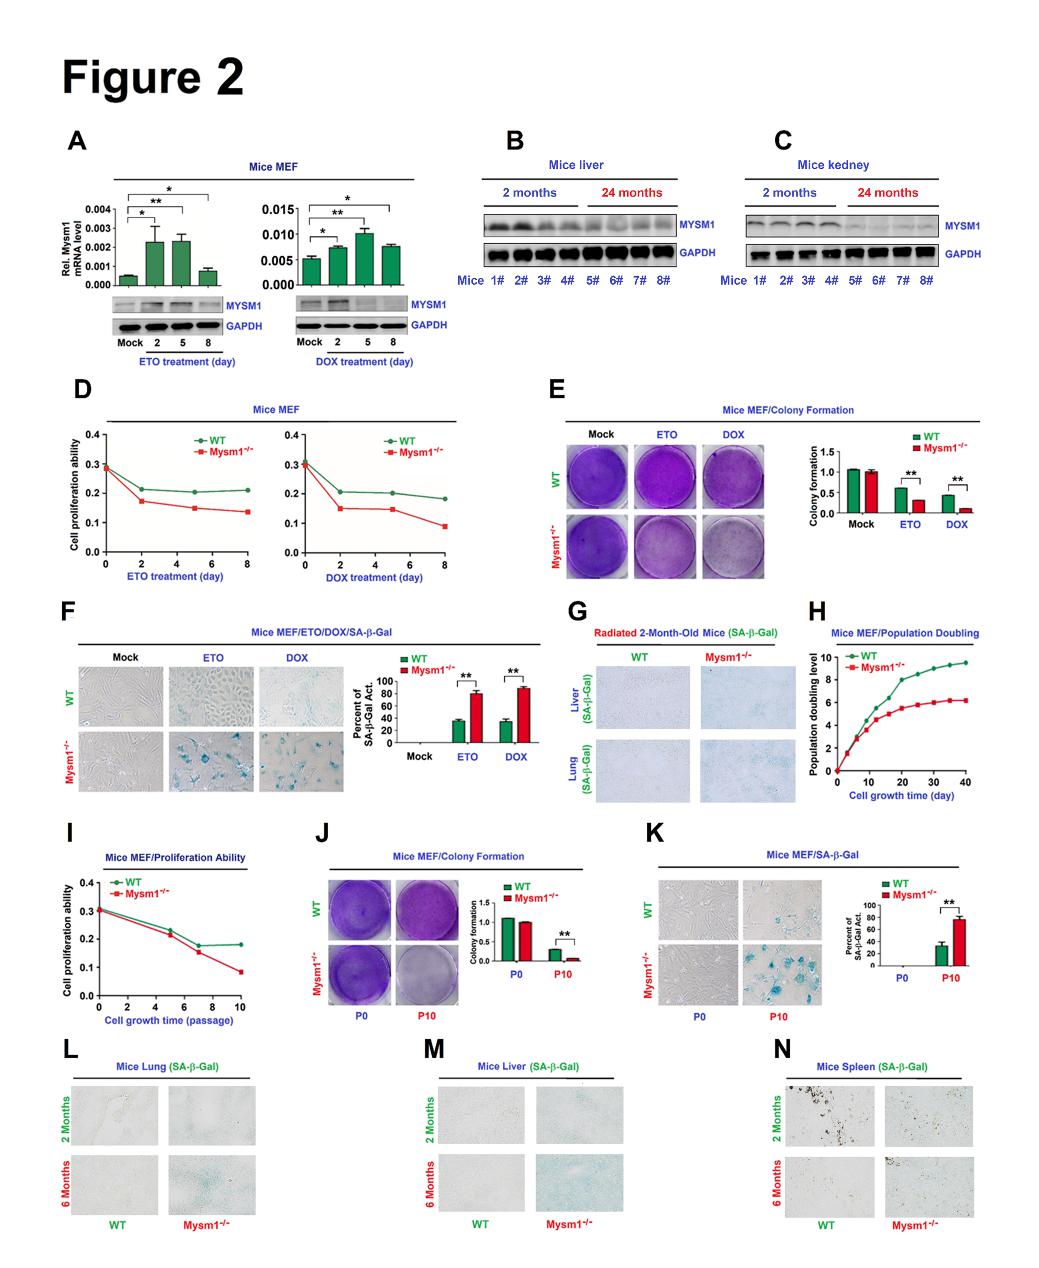
Figure 2. MYSM1 correlates with senescence. (A–C) C57BL/6 mice MEFs were treated with ETO or DOX (A). Kidney (B) and lung (C) tissues were excised from 2- and 22-month old WT mice (n=4 per group). MYSM1 and GAPDH protein levels were assessed by WB. (D–F) WT or Mysm1-/- mice MEFs were pre-treated with ETO or DOX for 48 h to induce senescence. Cell proliferation was determined (D). Colony formation was analyzed by crystal violet staining (E). SA-b-Gal activity was determined by X-gal staining (F). (G) 2-months old WT and Mysm1-/- mice were exposed to ionizing radiation (n=3 per group). SA-b-Gal activities in the lung and liver were determined by IHC. (H–K) WT or Mysm1-/- MEFs were grown continuously for different passages (P) or on different days (D). Population doubling levels were determined (H). Cell proliferation was measured (I).Colony formation was analyzed (J). SA-b-Gal activities were determined by X-gal staining (K). (L–N) SA-b-Gal activities in the lung (L), liver (M), and spleen (N) of 2- and 6-month-old WT and Mysm1-/- mice were determined by IHC analysis(n=3 per group). Scale bars = 50µm. Data presented as the mean ± SD. Statistical analyses were performed using an Unpaired t-test in Prism software. *p<0.05, **p<0.01, ***p<0.001. n.s. = no significance.
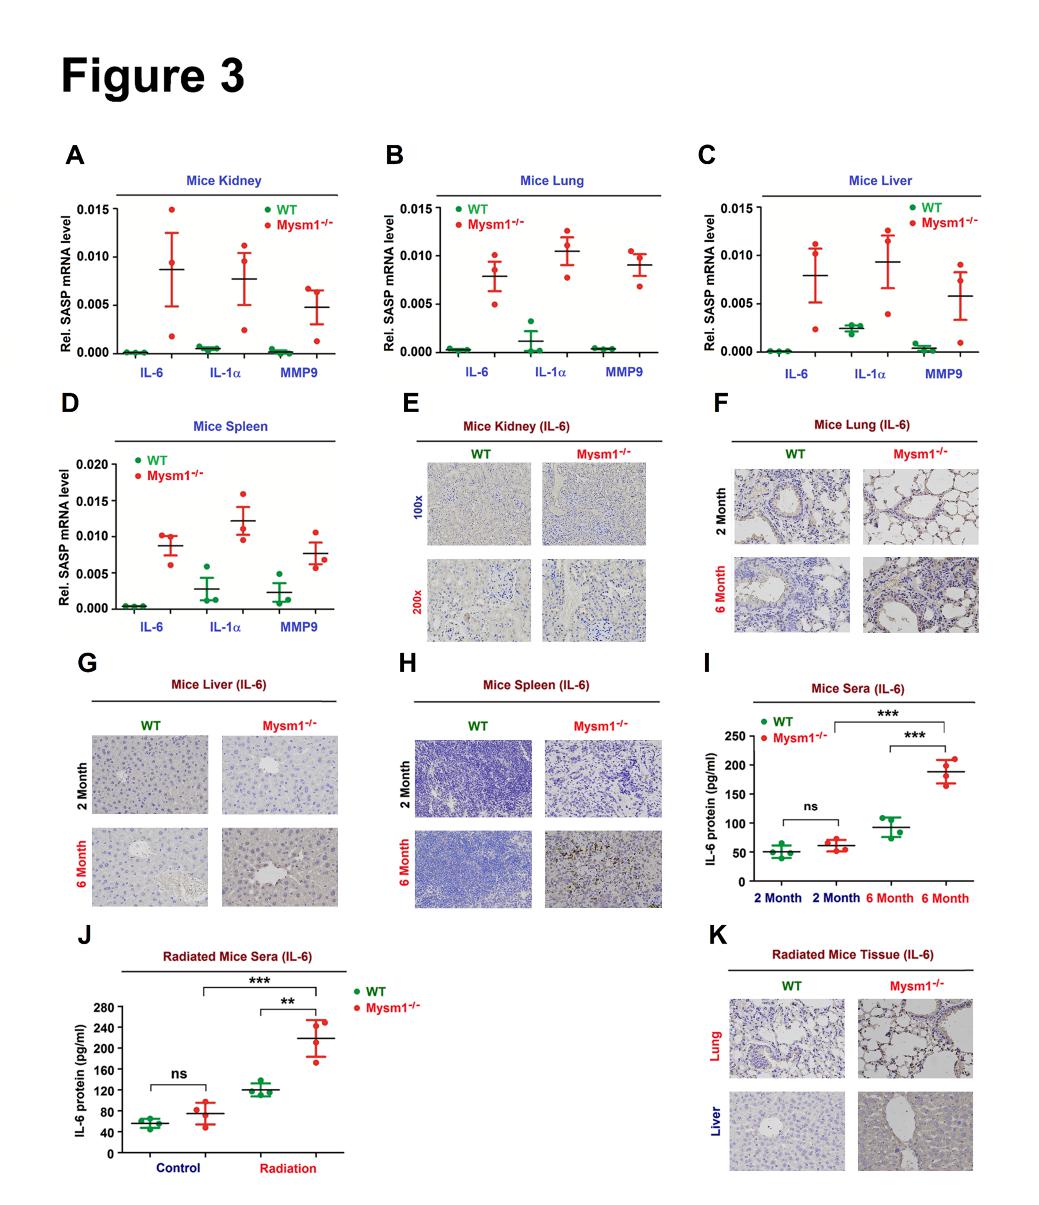
Figure 3. MYSM1 suppresses DDR-associated SASP. (A–D)IL-6, IL-1, and MMP3 mRNA levels in the kidney (A), lung (B), liver (C), and spleen (D) excised from 6-month-old WT and Mysm1-/- mice (n=3 per group) determined by RT-PCR. (E–H) IL-6 protein in the kidney (E), lung (F), liver (G), and spleen (H) excised from 6-month-old WT and Mysm1-/- mice (n=3 per group) analyzed by IHC. Scale bars = 50 µm. (I) IL-6 protein in the sera from 6-month-old WT and Mysm1-/- mice (n=3 per group) measured by ELISA. (J and K) 2-month-old WT and Mysm1-/- mice were exposed to IR (n=3 per group). IL-6 protein in the sera was measured by ELISA (J). IL-6 protein in the lung and liver was analyzed by IHC. Scale bars = 50 µm (K). Data are means ± SD. Statistical analyses were performed using an Unpaired t-test in Prism software. *p<0.05, **p<0.01, ***p<0.001. n.s. = no significance.
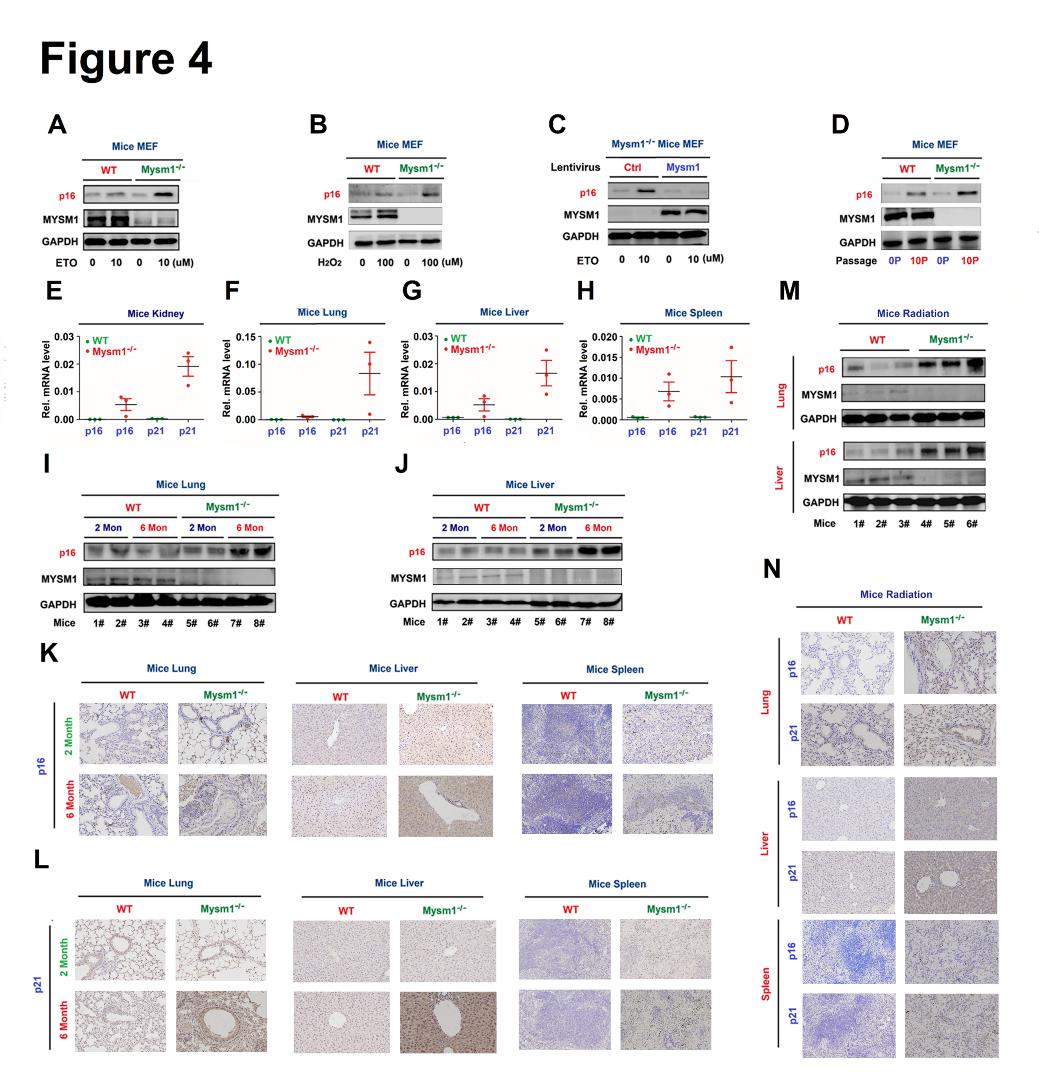
Figure 4. MYSM1 represses senescence in aged mice. (A–D) MEFs were treated with ETO (A) or H2O2 (B), infected with lentivirus expressing Mysm1 (C), or grown for different passages (D). p16, MYSM1, and GAPDH proteins were detected by WB. (E–H) p16 and p21 mRNA in the kidney (E), lung (F), liver (G), and spleen (H) of 6-month old WT and Mysm1-/- mice (n=3 per group) were determined by RT-PCR. (I and J) p16, MYSM1, and GAPDH proteins in the lung (I) and liver (J) of 2 and 6-month old WT and Mysm1-/- mice (n=3 per group) were detected by WB. (K and L) p16 protein (K) and p21 protein (L) in the lung, liver, and spleen excised from 6-month old WT and Mysm1-/- mice (n=3 per group) were measured by IHC. Scale bars, 50 µm. (M and N) 2-month-old WT and Mysm1-/- mice (n=3 per group) were exposed to IR. p16, MYSM1, and GAPDH protein levels in the lung and liver were determined by WB (M). p16 and p21 protein levels in the lung, liver, and spleen were analyzed by IHC. Scale bars = 50 µm (N). Data are means ± SD. Statistical analyses were performed using an Unpaired t-test in Prism software. n = 3 for each sample group. n.s. = no significance.
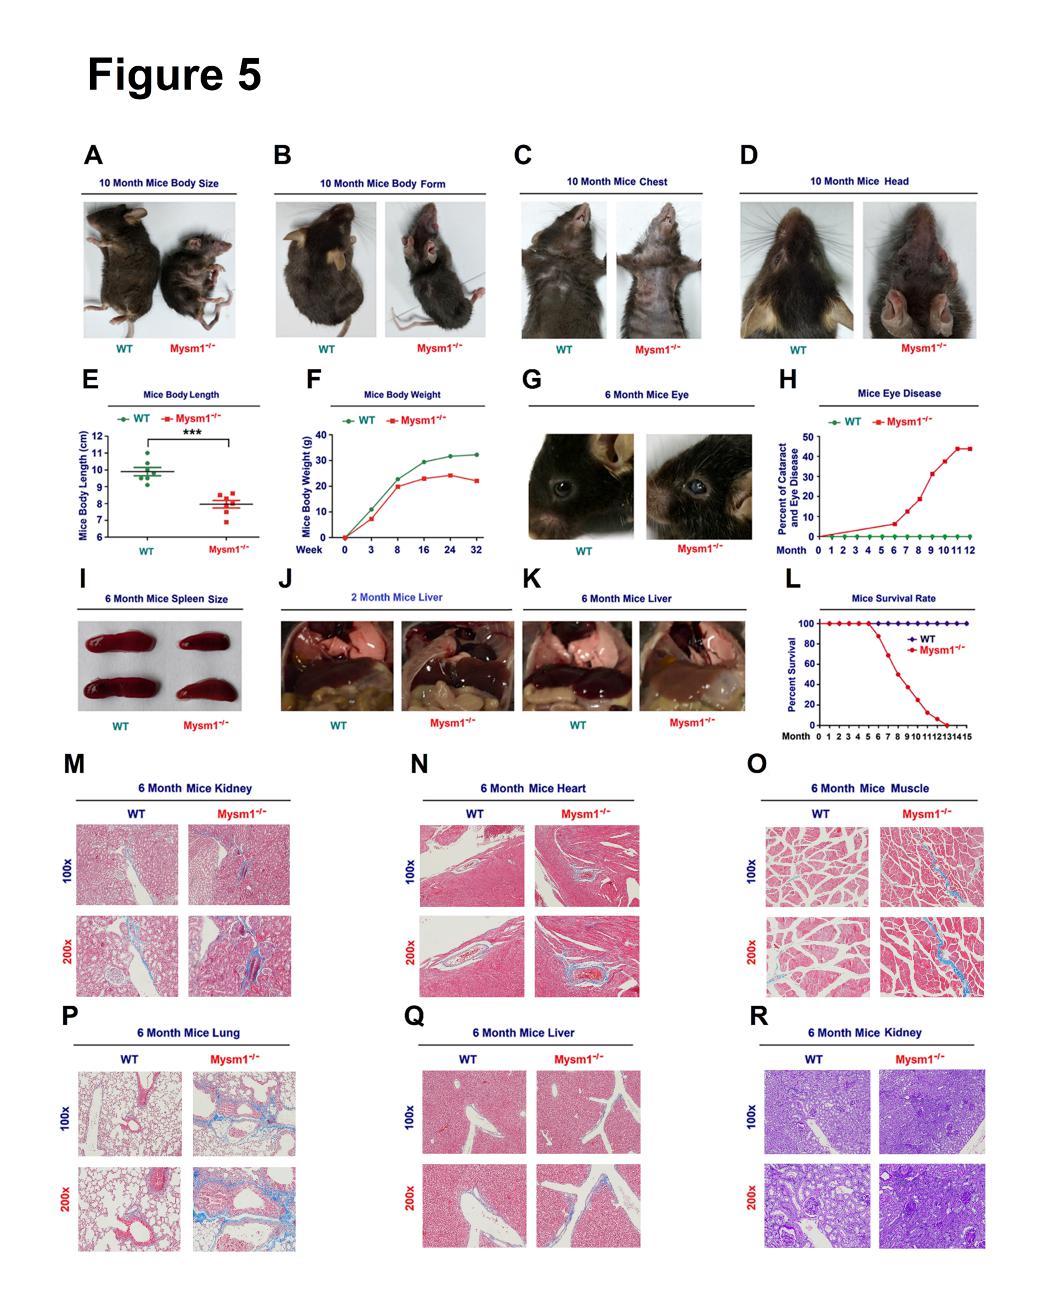
Figure 5. MYSM1 deficiency reduces the lifespan of mice. (A–D)Images of the body size (A), body form (B), chest (C), and head (D) of 10-month old WT and Mysm1-/- mice. (E) Analysis of body lengths (cm) of 2-month old WT and Mysm1-/- mice (n=7 per group). (F) Analysis of body weights of WT and Mysm1-/- mice (n=3 for each time-point). (G) Images of the eyes of 6-month old WT and Mysm1-/- mice. (H) Frequencies of cataracts and eye diseases in WT mice (n=16) and Mysm1-/- mice (n=17). (I) Images of spleens of 6-month old WT and Mysm1-/- mice (n=5 per group). (J) Images of livers of 2-month oldWT and Mysm1-/- mice (n=5 per group). (K) Images of liver of 6-month old WT and Mysm1-/- mice (n=5 per group). (L) Survival rates of WT mice (n=6) and Mysm1-/- mice (n=7). (M–Q) Masson’s trichrome staining images of kidney (M), heart (N), muscle (O), lung (P), and liver (Q) of 6-month-old WT and Mysm1-/- mice (n=3 per group). Scale bars, 100×=100µm, 200×=50µm. (R) Periodic acid Schiff (PAS) histochemical staining analyses of 6-month old WT and Mysm1-/- mice kidney (n=3 per group). Scale bars, 100×=100µm, 200×=50µm. Data are means ± SD. Statistical analyses were done by using Prism software by Unpaired t-tests. ***p<0.001.
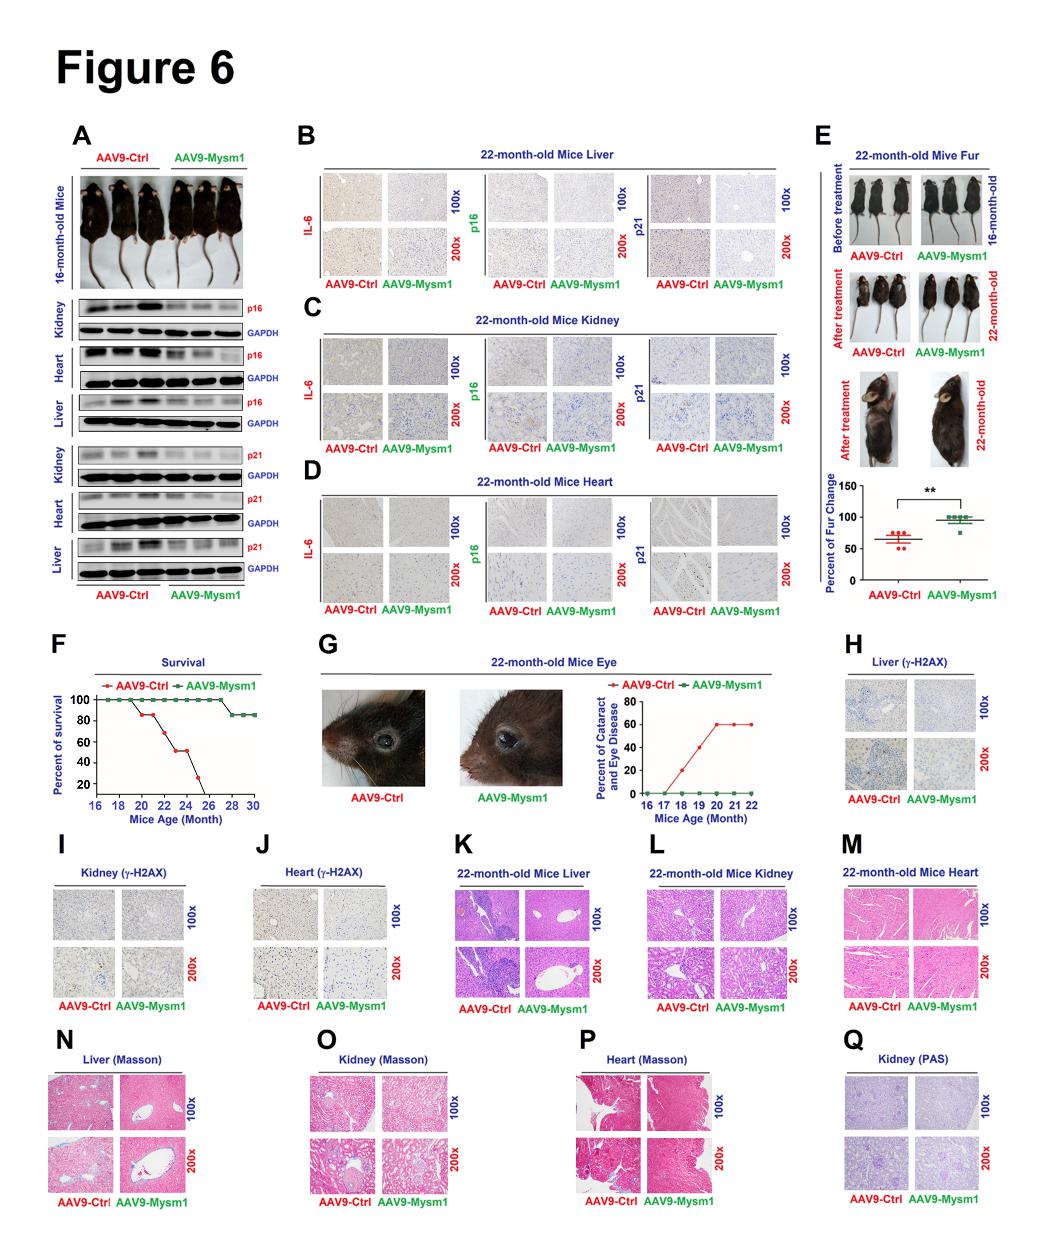
Figure 6. MYSM1 overexpression enhances mice lifespan. (A–D) 14-month-old WT mice were treated with AAV9-Ctrl (n=4) or AAV9-Mysm1 (n=5) for 2 months. Images of 16-month old mice after the treatments (A, top). p16 and p21 proteins in the kidney and heart were measured by WB (a, middle and bottom). IL-6 (left), p16 (middle), and p21 (right) in the liver (B), kidney (C), and heart (D) of the treated mice were measured by IHC. Scale bars, 100×=100µm, 200×=50µm. (E–Q) 16-month old WT mice were treated with AAV9-Ctrl or AAV9-Mysml for 6 months (n=5 per group). Images of mice before and after the treatments (E, top), images of mice furs after the treatments (E, middle), and analysis of fur changes intreated mice (E, bottom). Survival rates of treated mice treated with AAV9-Ctrl or AAV9-Mysml for 14 months (n=5 per group) (F). Images of the eyes of the treated mice and analysis of frequencies of cataracts and eye diseases (right) (G). g-H2AX produced in the liver, kidney, and heart of the treated mice were detected by IHC (H–J). H&E stained images of the liver, kidney, and heart of the treated mice (K–M). Masson trichrome staining analyses of the liver, kidney, and heart of the treated mice (N–P). PAS analyses of the treated mice kidney (Q). Scale bars, 10× = 100µm, 20× = 50µm. Data are presented as the means ± SD. Statistical analyses were performed using Unpaired t-tests in Prism software.
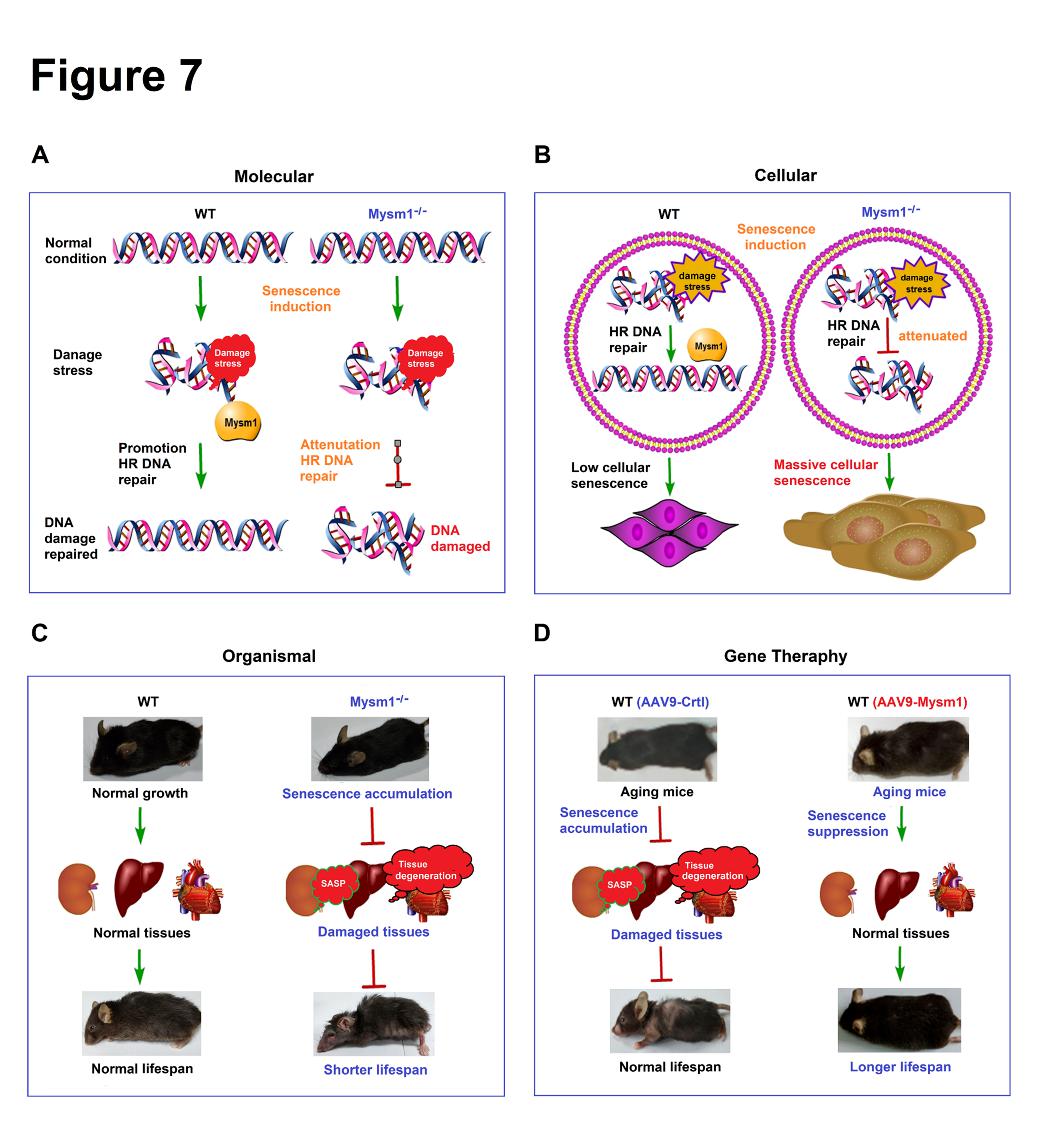
Figure 7. MYSM1 is a key suppressor of aging and aging-related pathology. (A) The role of MYSM1 in promoting DNA repair. (B) The function of MYSM1 in repressing cellular senescence and the aging process. (C) MYSM1 deficiency facilitates aging, promotes aging-related pathology, and reduces the lifespan of mice. (D) MYSM1 over-expression attenuates the aging process, reduces aging-related pathology, and extends the lifespan of mice.
病原微生物研究院